

Often times, when we talk about data science projects, it seems very vague as to how the entire process from gathering the data, all the way up to the analysis and results of the data come about.
In this post, we break down the entire data science framework, taking you through each step of the project lifecycle, while discussing what are the key skills and requirements of it.
Data Science Process – OSEMN framework
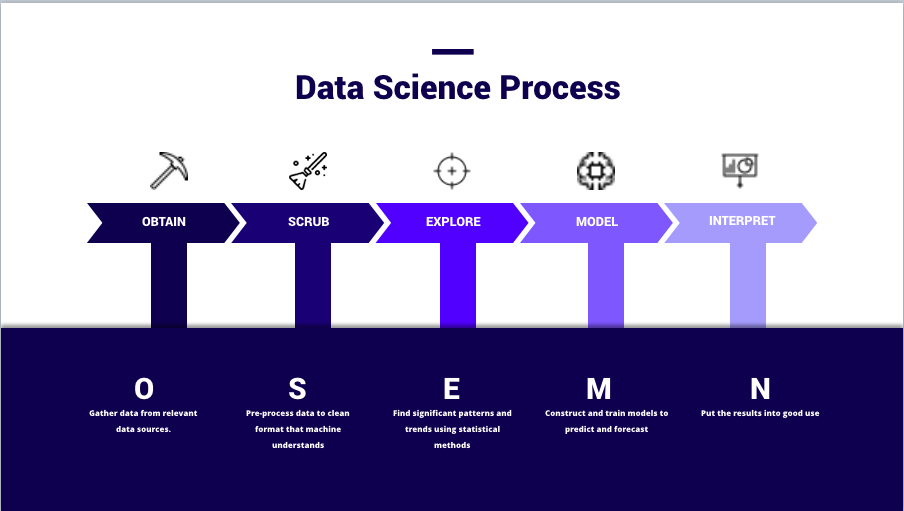
We will be discussing this process with the easy-to-understand OSEMN framework which covers every step of the data science project lifecycle from end to end.
1. Obtaining Data
The very first step of any data science project is pretty much straightforward, that is to collect and obtain the data you need. If you do not have any data at all, you will not be able to have anything to process.

In this step, you will need to query databases, and this will include a technical skillset like MySQL to process the data. You may even start out with simple formats like Microsoft Excel to obtain the data and then, later on, convert it into usable data. If you are using Python or R, they have specific packages that can directly read data from these platforms into the programmes.
For the sake of systems’ requirement, you may need to use programmes like PostgresSQL, Oracle, or MongoDB. Or else, another way to go about it is by using frameworks and techniques to obtain data from the internet via web scraping, such as Beautiful Soup.
On top of that, another option is connecting to Web APIs. Websites such as Facebook and Twitter allows end-users to connect to their web servers and scrap their data. All you need to do is to use their Web API to crawl their data.
And of course, the most traditional way of obtaining data is directly from files, such as downloading it from Kaggle or even corporate assisting data which may provide you with CSV (Comma Separated Value) files or TSV (Tab Separated Values) files. These files are all flat text files, hence you will need to use it in special Parser format, as it is not natively understood by a regular programming language like Python.
Skills Required:
In order to perform the tasks above, you will need certain technical skills. For example, for Database management, you will need to know how to use MySQL, PostgreSQL or MongoDB (if you are using a non-structured set of data).
If you are looking to work on projects on a much bigger data sets, or big data, then you need to learn how to access tthis distributed storage using Apache Hadoop, Spark or Flink to help you.
2. Scrubbing Data
The main task in the scrubbing data process is for us to “clean” and filter the data. Remember the “garbage in, garbage out” philosophy in which if the data used is unfiltered and irrelevant, the results of the analysis will not mean anything as well.
In this process, you need to convert the data from one format to another and consolidate everything into one standardized format across all data. For example, if your data is collected in CSV files, then you will need to apply SQL queries to these CSV data so that you will be able to pair it with programming languages like Python or R.
In some situations, we will also need to filter the lines if you are handling locked files. Locked files refer to web locked files where you get to understand data such as the demographics of the users, time of entrance into your websites etc.
On top of that, scrubbing data also includes the task of extracting and replacing values. If you realize there are missing data sets or they could appear to be non-values, this is the time to replace them accordingly.
Lastly, you will also need to split, merge and extract columns. For example, for the place of origin, you may have both “City” and “State”. Depending on your requirements, you might need to either merge or split these data.
Think of this process as organising and tidying up the data, removing what is no longer needed, replacing what is missing and standardising the format across all the data collected.
Skills Required:
For this process, you will need certain advanced data mining tools like Python or R to help you do the scripting. Otherwise, you may also purchase enterprise softwares like SAS Enterprise Miner to help you ease through this process.
In terms of Data Wrangling tools, you can either use the basic Python or R, or else you can use Pandas to help you do the processing.
Same as the above, big data sets will require you to have skills in Hadoop, Map Reduce or Spark. These tools can help you scrub the data and run the scripting.
3. Exploring Data
Once your data is ready to be used, and right before you jump into AI and Machine Learning, you will have to explore the data.
Usually, in a corporate or business environment, your bosses will just throw you a set of data and its up to you to make sense of it. So it will be up to you to help them figure out the business question and transform them into a data science question.

In order to achieve that, this process comes into place. First of all, you will need to inspect the data and all its properties. There are different types of data like numerical data, categorical data, ordinal and nominal data etc. With that, there are different types of data characteristics which will require you to handle them differently.
Following that, the next step would be to compute descriptive statistics to to extract features and test significant variables. Testing significant variables often times is done with correlation. For example, exploring the correlation of the risk of someone getting high blood pressure in relations to their height and weight. Do note that some variables are correlated, but to significant in terms of the model.
The term “Feature” used in Machine Learning or Modelling, is the data features to help you identify what are the characteristics that represent this database. For example, “Name”, “Age”, “Gender” are features of your dataset.
Lastly, you will have to be able to gain some data visualisation which can help you identify patterns and trends in your data. We can gain a better data visualisation through simple formatting of charts, such as pie charts, line charts or bar charts etc. This can help you find a more significant importance of the data.
Skills Required:
If you are using Python, you will need to know how to use Numpy, Matplotlib, Pandas or Scipy; if you are using R, you will need to use GGplot2 or Dplyr. On top of that, you need to have knowledge and skills in experimental design, inferential statistics and data visualisation.
As much as you do not need a Masters or PHD to do data science, but these technical skills are very important in order to conduct an experimental design, so you are able to reproduce the results.
Additional Tips in Exploring Data:
- Have a very raw sense of curiosity. This can help you develop your senses to spot weird patterns and trends.
- Focus on your audience, and understand what they would like to learn, so you are able to present the data in such a way that makes sense to them.
4. Modelling Data
This is the most interesting stage of the data science project lifecycle. As many people would call it “where the magic happens”.
Once again, before reaching to this stage, bear in mind that the scrubbing and exploring stage is crucial in order for this process to make sense. So take your time on those stages instead of jumping right to this process.
One of the first things you need to do in modelling data, is to reduce the dimensionality of your data set. Not all your features or values are essential to predicting your model. Hence, what you need to do is to select the relevant ones that will contribute to the prediction of results you are looking for.

Other than classification or prediction of the results, our purpose of this stage can also include the grouping of data to understand the logic behind those clusters. For example, you would like to group your e-commerce customers to understand their behaviour on your website. So this would require you identify groups of data points with clustering algorithms, using methods like k-means; or make predictions using regressions like linear or logistic regressions.
Lastly, in this step, you can also train models to perform classification. For example, like differentiating the mails you received as “Inbox” and “Spam mail”.
In short, regression and predictions are used to forecast future values, and classification is for you to identify and group your values.
Skills Required:
In Machine Learning, the skills you will need is both supervised and unsupervised algorithms. For libraries, if you are using Python, you will need to know how to use Sci-kit Learn; and if you are using R, you will need to use CARET.
After the modelling process, you will need to be able to use evaluation methods like linear algebra, multivariate calculus, probability etc. For example, the widely used ones are area under the curve, or information retrieval etc.
5. Interpreting Data
We are at the final and most important step of the data science project, that is, interpreting data. Interpreting data basically refers to the presentation of your data, delivering the results in such a way that is able to answer the business questions you asked when you first started the project, together with the actionable insights that is found through data science.

Actionable insights is a key outcome in which we can show that data science can bring about predictive analytics and later on prescriptive analytics, in which we can learn how to repeat a good outcome, or prevent a negative outcome.
On top of that, you will need to visualize your findings accordingly, keeping it driven by your business questions. It is very important to be able to present your findings in such a way that is useful to your organization, or else it would be pointless to your stakeholders.
In this process, technical skills only is not sufficient. One very important skill you need is to be able to tell a very clear and actionable story. If your presentation does not trigger actions in your audience, it means that your communication was not efficient. Remember that you will be presenting to an audience with no technical background, so the way you communicate the message is key.
Skills Required:
As mentioned, in this process, the key skills to have is beyond technical skills, and you will need strong business domain knowledge to present your findings in a way that can answer the business questions you set out to answer and translate into actionable steps to follow.
Some basic technical skills needed would be data visualization tools like Matplotlib, GGPlot, Seaborn, Tableau, d3js etc.
Lastly, we cannot emphasize this enough, soft skills like presenting and communication skills, paired with a flair for reporting and writing skills will definitely help you in this stage of the project lifecycle.
Data Science Roles in OSEMN :
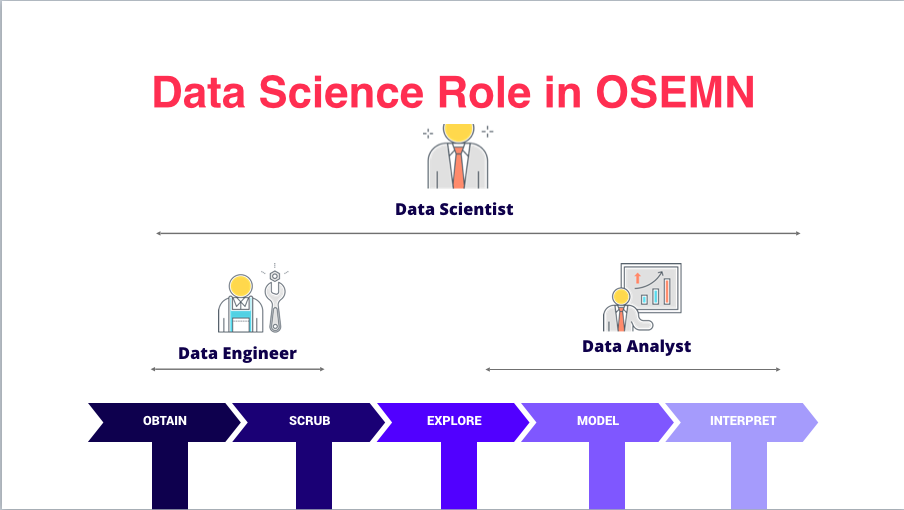
Data Engineers:
– Focus on Obtaining and Scrubbing the data
Data Analysts:
– Explore, Model and Interpret the data to make sense of the data collected
Data Scientists:
– Oversee the entire project from end to end, so you are able to architect the entire data framework, and eventually bringing it through the production process
As this is a very detailed post, here is the key takeaway points:
There are altogether 5 steps of a data science project starting from Obtaining Data, Scrubbing Data, Exploring Data, Modelling Data and ending with Interpretation of Data.
One very key step is Scrubbing Data, as this will ensure that the data that is processed and analysed is relevant to what our project sets out to do. Hence, do spend some extra time on this stage, as it will largely contribute to the findings of your project.
With that, we hope you have gained a better understanding of how a data science project is carried out from end to end. If you are interested to learn how to actually execute a data science project like this, you can check out our Data Science 360 program which guides you through big data, data science, data analytics and prepare you to be a job-ready data scientist in just a span of 6 weeks.
If you enjoy content like this on all things data science, Machine Learning, AI, Web, and Mobile App Development, visit our Facebook Page and YouTube channel for more content.
If you have any questions about these topics, or about the courses we offer, do drop us a message or comment in the comment section below and we will be more than happy to answer them.
Hi,
Nice post!
I think that the role of ML Engineer is also required. It helps to “package” the model and required components to facilitate their deployment.
Skills are: Python, Flask, Cloud functions, or Cloud platforms
Thanks